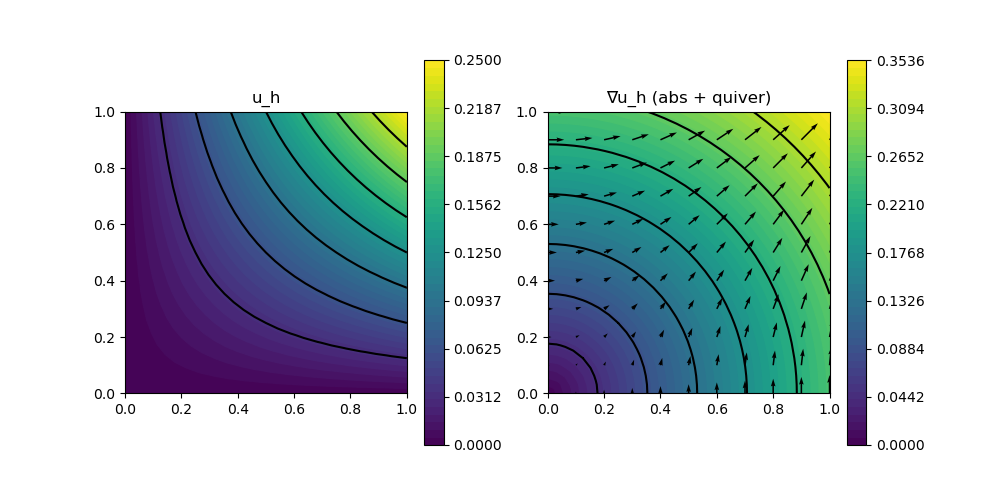
206 : Nonlinear Poisson Transient 2D
This example computes a transient velocity $\mathbf{u}$ solution of the nonlinear Poisson problem
\[\begin{aligned} \mathbf{u}_t - \mathrm{div}(\alpha(u) \nabla \mathbf{u}) & = \mathbf{f}\\ \end{aligned}\]
with (some time-dependent) exterior force $\mathbf{f}$, some diffusion coefficient $\alpha(\mathbf{u}) = (1+\beta\mathbf{u}^2)$. Therein parameter $\beta$ steers the strength of the nonlinearity.
The time integration will be performed by the internal CrankNicolson rule (or optionally BackwardEuler) of GradientRobustMultiPhysics. A manufactureed quadratic-in-space and quadratic-in-time solution is prescribed to test if the solver computes the exact solution.
module Example206_NonlinearPoissonTransient2D

using GradientRobustMultiPhysics
using ExtendableGrids
using GridVisualize

const α = DataFunction((result, u) -> (result[1] = (1+u[1]^2);), [1,1]; Tv = Real, dependencies = "X", name = "1+u(x)^2")

function get_problem_data(t_power)
    u = DataFunction((result,x,t) -> (result[1] = x[1]*x[2]*(1-t)^t_power), [1,2]; dependencies = "XT", bonus_quadorder = 2)
    ut = eval_dt(u)
    Δu = eval_Δ(u)
    ∇u = eval_∇(u)
    ∇α = eval_∇(α)
    function rhs!(result, x, t) # computes u_t -div(α(u)*grad(u)) = u_t -(∇α ∇u + αΔu)
        u_val = u(x, t)
        ∇u_val = ∇u(x, t)
        result .= ut(x,t) .- dot(α(u_val), Δu(x)) .- dot(∇α(u_val) * ∇u_val, ∇u_val)
        return nothing
    end
    f = DataFunction(rhs!, [1,2]; name = "∇(u)", dependencies = "XT", bonus_quadorder = 4)
    return u, f
end

# kernel for nonlinear diffusion operator
function diffusion_kernel!(result, input)
    # input = [u, grad(u)]
    α_val = α(input[1])
    result[1] = α_val[1]*input[2]
    result[2] = α_val[1]*input[3]
    return nothing
end

# everything is wrapped in a main function
function main(; verbosity = 0, Plotter = nothing, nlevels = 3, timestep = 1e-1, T = 0.5, FEType = H1P2{1,2}, time_integration_rule = CrankNicolson, t_power = 2, testmode = false)

    # set log level
    set_verbosity(verbosity)

    # set exact solution and data
    u, f = get_problem_data(t_power)

    # initial grid and final time
    xgrid = uniform_refine(grid_unitsquare(Triangle2D),1)

    # prepare nonlinear expression (1+u^2)*grad(u)
    nonlin_diffusion = NonlinearForm(Gradient, [Identity, Gradient], [1,1], diffusion_kernel!, [2,3]; name = "((1+#1^2) ∇#2, ∇#T)", bonus_quadorder = 2, newton = true)

    # generate problem description and assign nonlinear operator and data
    Problem = PDEDescription("nonlinear Poisson problem")
    add_unknown!(Problem; unknown_name = "u", equation_name = "nonlinear Poisson equation")
    add_operator!(Problem, [1,1], nonlin_diffusion)
    add_boundarydata!(Problem, 1, [1,2,3,4], BestapproxDirichletBoundary; data = u)
    add_rhsdata!(Problem, 1,  LinearForm(Identity, f))

    # define error evaluators
    L2Error = L2ErrorIntegrator(u, Identity; time = T)
    H1Error = L2ErrorIntegrator(∇(u), Gradient; time = T)
    NDofs = zeros(Int,nlevels)
    Results = zeros(Float64,nlevels,2)

    # loop over levels
    Solution = nothing
    for level = 1 : nlevels
        # refine grid
        xgrid = uniform_refine(xgrid)

        # generate FESpace and solution vector
        FES = FESpace{FEType}(xgrid)
        Solution = FEVector(FES)

        # set initial solution
        interpolate!(Solution[1], u)

        # generate time-dependent solver
        sys = TimeControlSolver(Problem, Solution, time_integration_rule; timedependent_equations = [1], maxiterations = 5)

        # use time control solver by GradientRobustMultiPhysics
        advance_until_time!(sys, timestep, T)

        # calculate L2 and H1 error and save data
        NDofs[level] = length(Solution.entries)
        Results[level,1] = sqrt(evaluate(L2Error,Solution[1]))
        Results[level,2] = sqrt(evaluate(H1Error,Solution[1]))
    end

    if testmode == true
        return Results[end,2]
    else
        p = GridVisualizer(; Plotter = Plotter, layout = (1,2), clear = true, resolution = (1000,500))
        scalarplot!(p[1,1], xgrid, nodevalues_view(Solution[1])[1], levels = 7, title = "u_h")
        scalarplot!(p[1,2], xgrid, view(nodevalues(Solution[1], Gradient; abs = true),1,:), levels = 7, title = "∇u_h (abs + quiver)")
        vectorplot!(p[1,2], xgrid, evaluate(PointEvaluator(Solution[1], Gradient)), spacing = 0.1, clear = false)

        # print/plot convergence history
        print_convergencehistory(NDofs, Results; X_to_h = X -> X.^(-1/2), ylabels = ["|| u - u_h ||", "|| ∇(u - u_h) ||"])
    end
end

function test()
    error1 = main(; nlevels = 1, FEType = H1P2{1,2}, t_power = 1, time_integration_rule = BackwardEuler, testmode = true)
    error2 = main(; nlevels = 1, FEType = H1P2{1,2}, t_power = 2, time_integration_rule = CrankNicolson, testmode = true)
    return max(error1,error2)
end

end
This page was generated using Literate.jl.
