A08 : Basis-Plotter
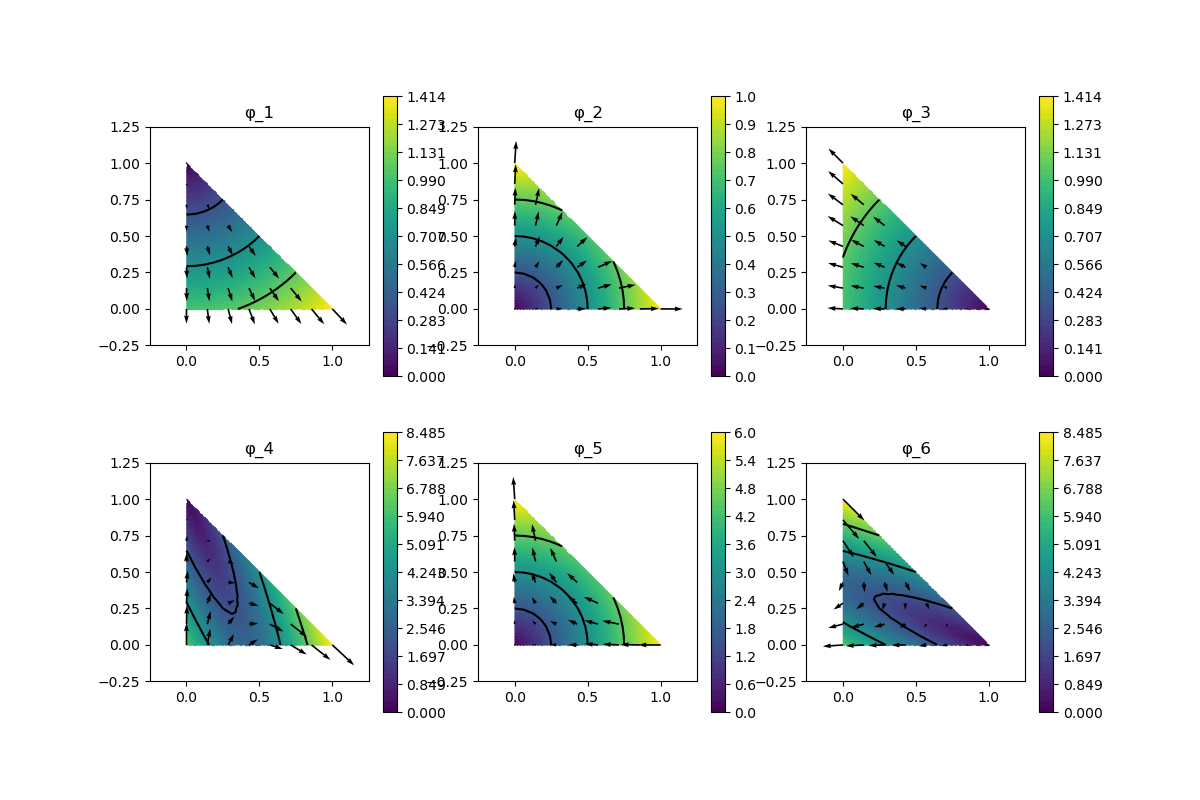
This example shows how to plot all the basis functions of a finite element on a reference geometry
module ExampleA08_BasisPlotter

using GradientRobustMultiPhysics
using ExtendableGrids
using GridVisualize

# everything is wrapped in a main function
function main(; refgeom = Triangle2D, nrefinements_for_plot = 4, nplots_per_row = num_nodes(refgeom), plotsize = 400, Plotter = nothing)

    # generate two grids
    xgrid = reference_domain(refgeom)
    xgrid_fine = split_grid_into(xgrid, dim_element(refgeom) == 2 ? Triangle2D : Tetrahedron3D)
    xgrid_fine = uniform_refine(xgrid_fine, nrefinements_for_plot)

    # set finite element type and get some information
    FEType = HDIVBDM1{2}
    ncomponents = get_ncomponents(FEType)
    ndofs = get_ndofs(ON_CELLS, FEType, refgeom)

    # generate FEVector that carry the basis functions
    FEFunc = FEVector(FESpace{FEType}(xgrid))
    FEFunc_fine = FEVector(FESpace{H1P1{ncomponents}}(xgrid_fine))

    # prepare plot layout
    nrows = Int(ceil(ndofs/nplots_per_row))
    p = GridVisualizer(; Plotter = Plotter, layout = (nrows,nplots_per_row), clear = true, resolution = (plotsize*nplots_per_row,nrows*plotsize))

    # loop over all basis functions
    # interpolate on fine grid and plot
    nodevalues = zeros(Float64,2,num_nodes(xgrid_fine))
    col::Int, row::Int = 1, 1
    for j = 1 : ndofs
        fill!(FEFunc.entries,0)
        FEFunc.entries[j] = 1
        interpolate!(FEFunc_fine[1], FEFunc[1])
        nodevalues!(nodevalues,FEFunc_fine[1])
        if ncomponents > 1 # vector-valued functions are plotted abs + quiver
            scalarplot!(p[row,col], xgrid_fine, view(sqrt.(sum(nodevalues.^2, dims = 1)),1,:), levels = 3, colorbarticks = 11, xlimits = [-0.25,1.25], ylimits = [-0.25,1.25], title = "φ_$j")
            vectorplot!(p[row,col], xgrid_fine, nodevalues, clear = false, spacing = 1/7, title = "φ_$j")
        else
            scalarplot!(p[row,col], xgrid_fine, view(nodevalues,1,:), levels = 7, title = "φ_$j")
        end
        if col == nplots_per_row
            row += 1
            col = 1
        else
            col += 1
        end
    end
end
end
This page was generated using Literate.jl.